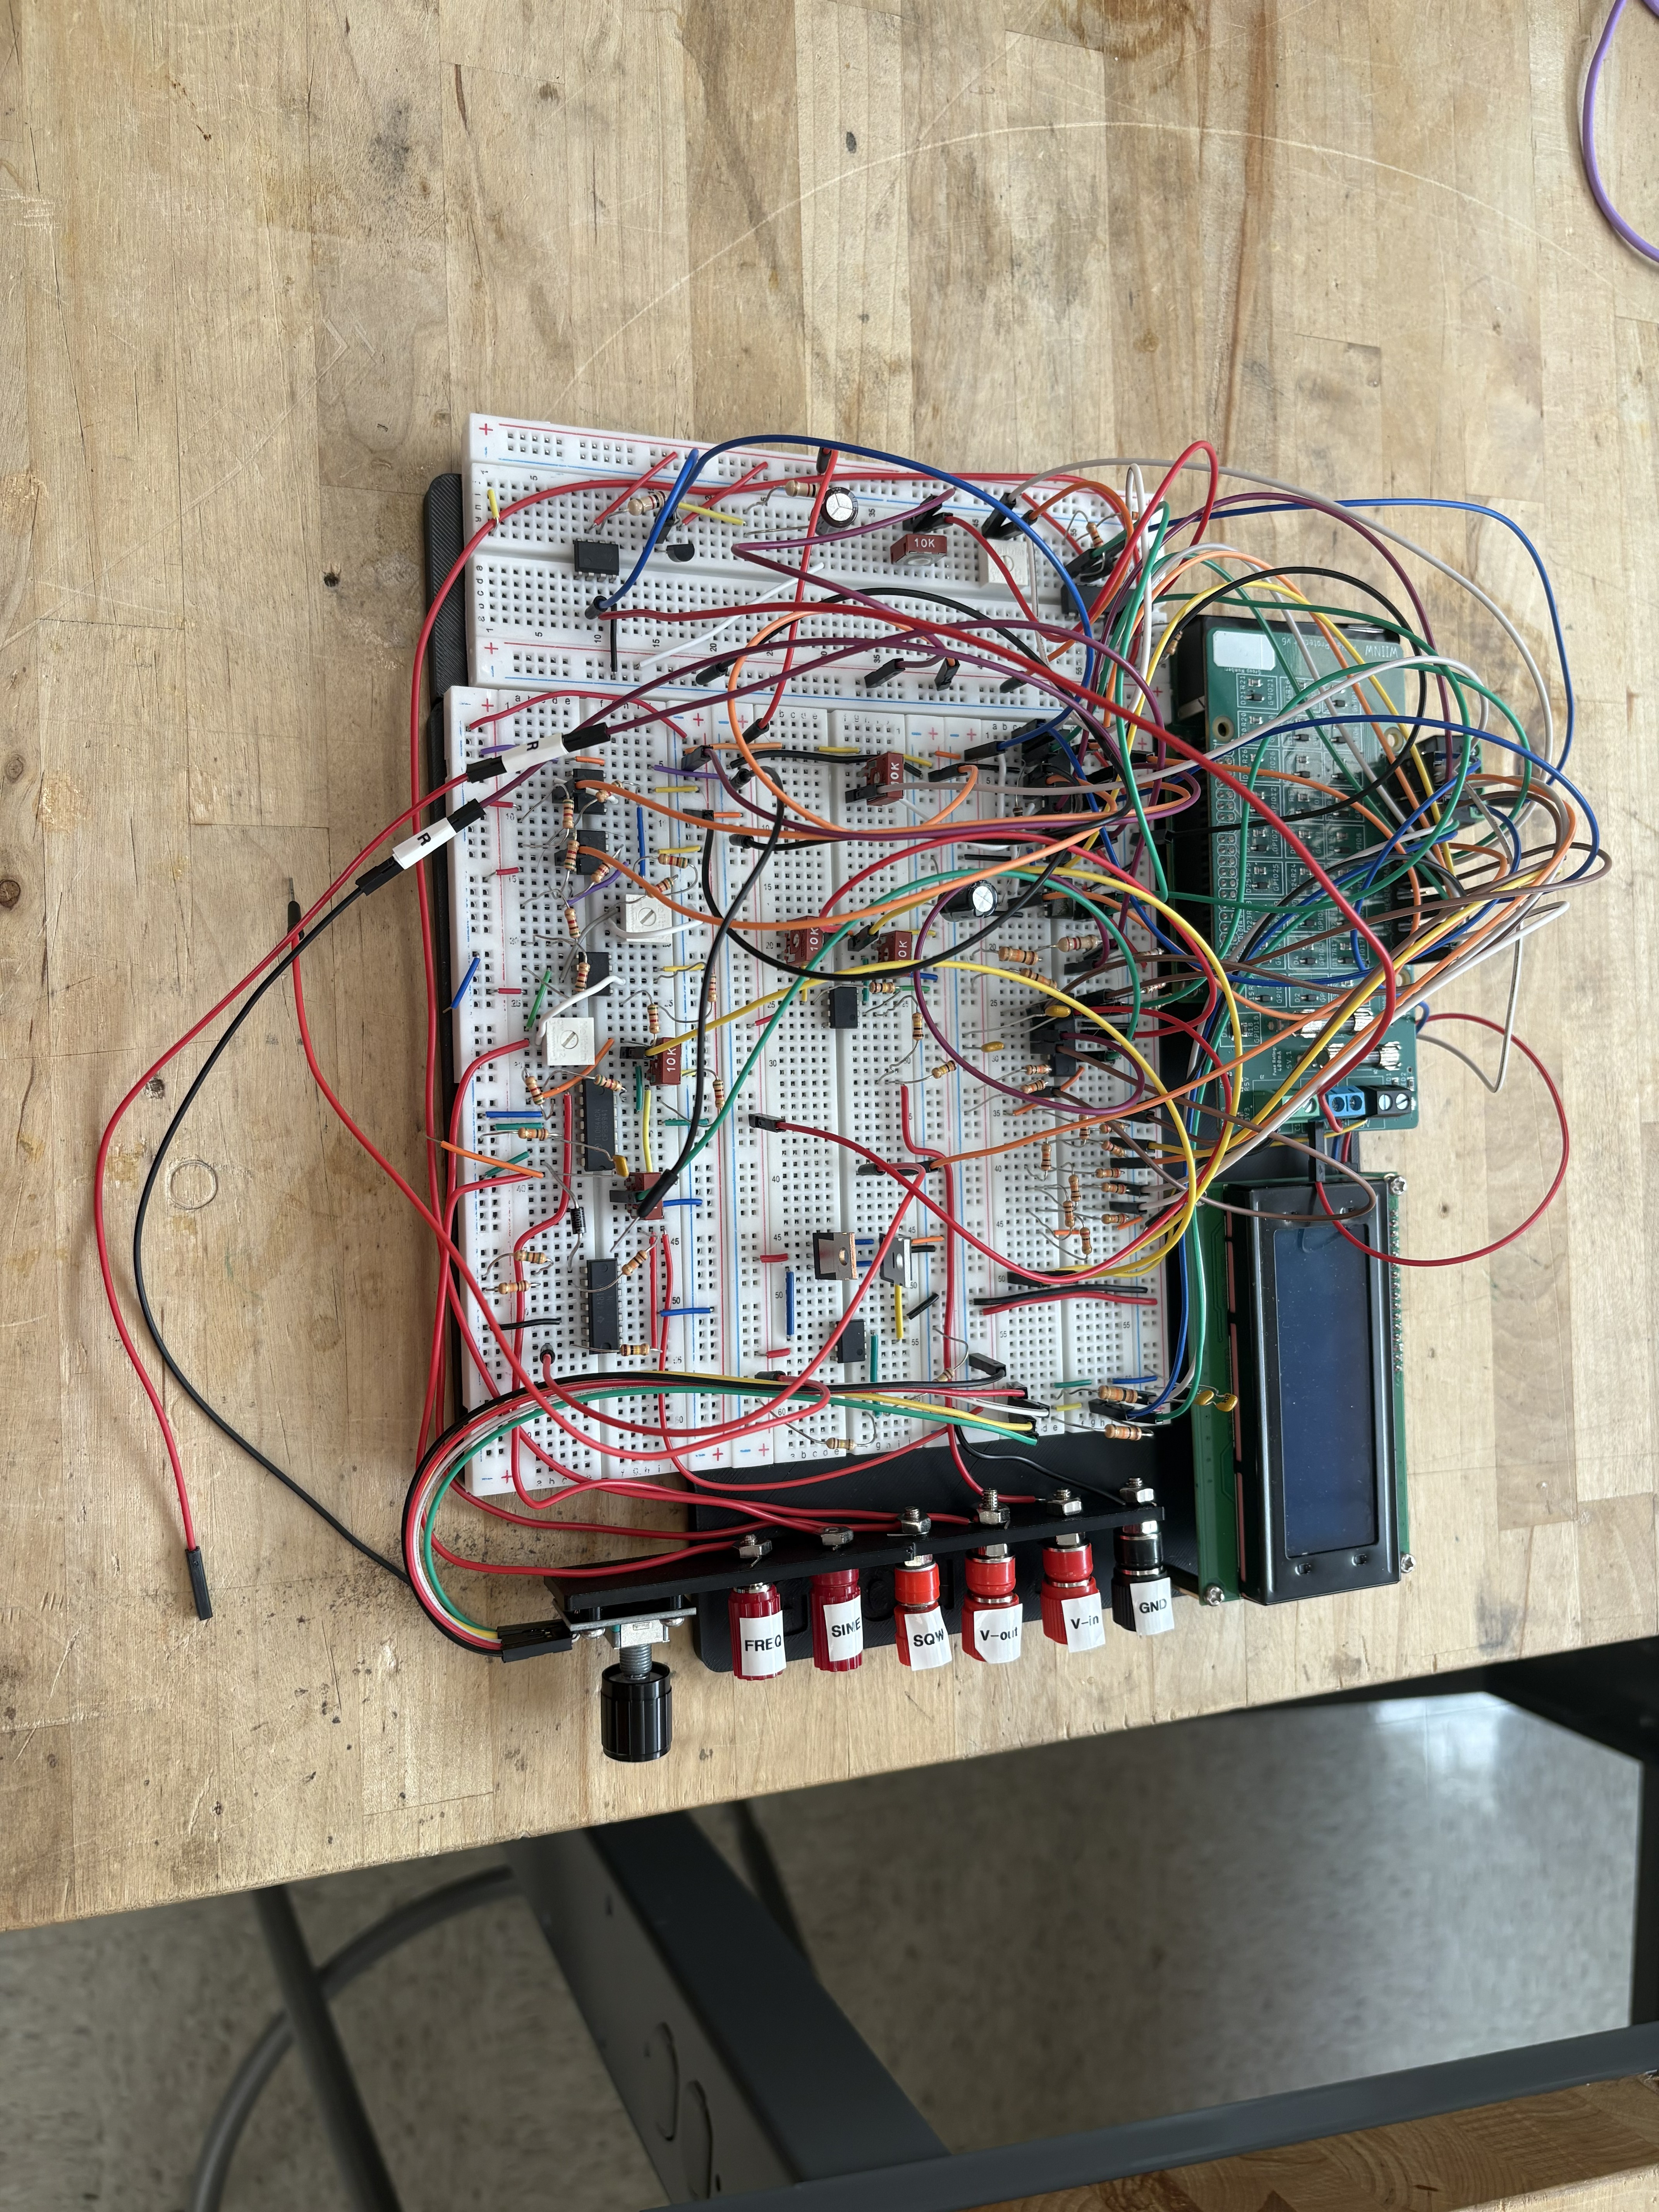
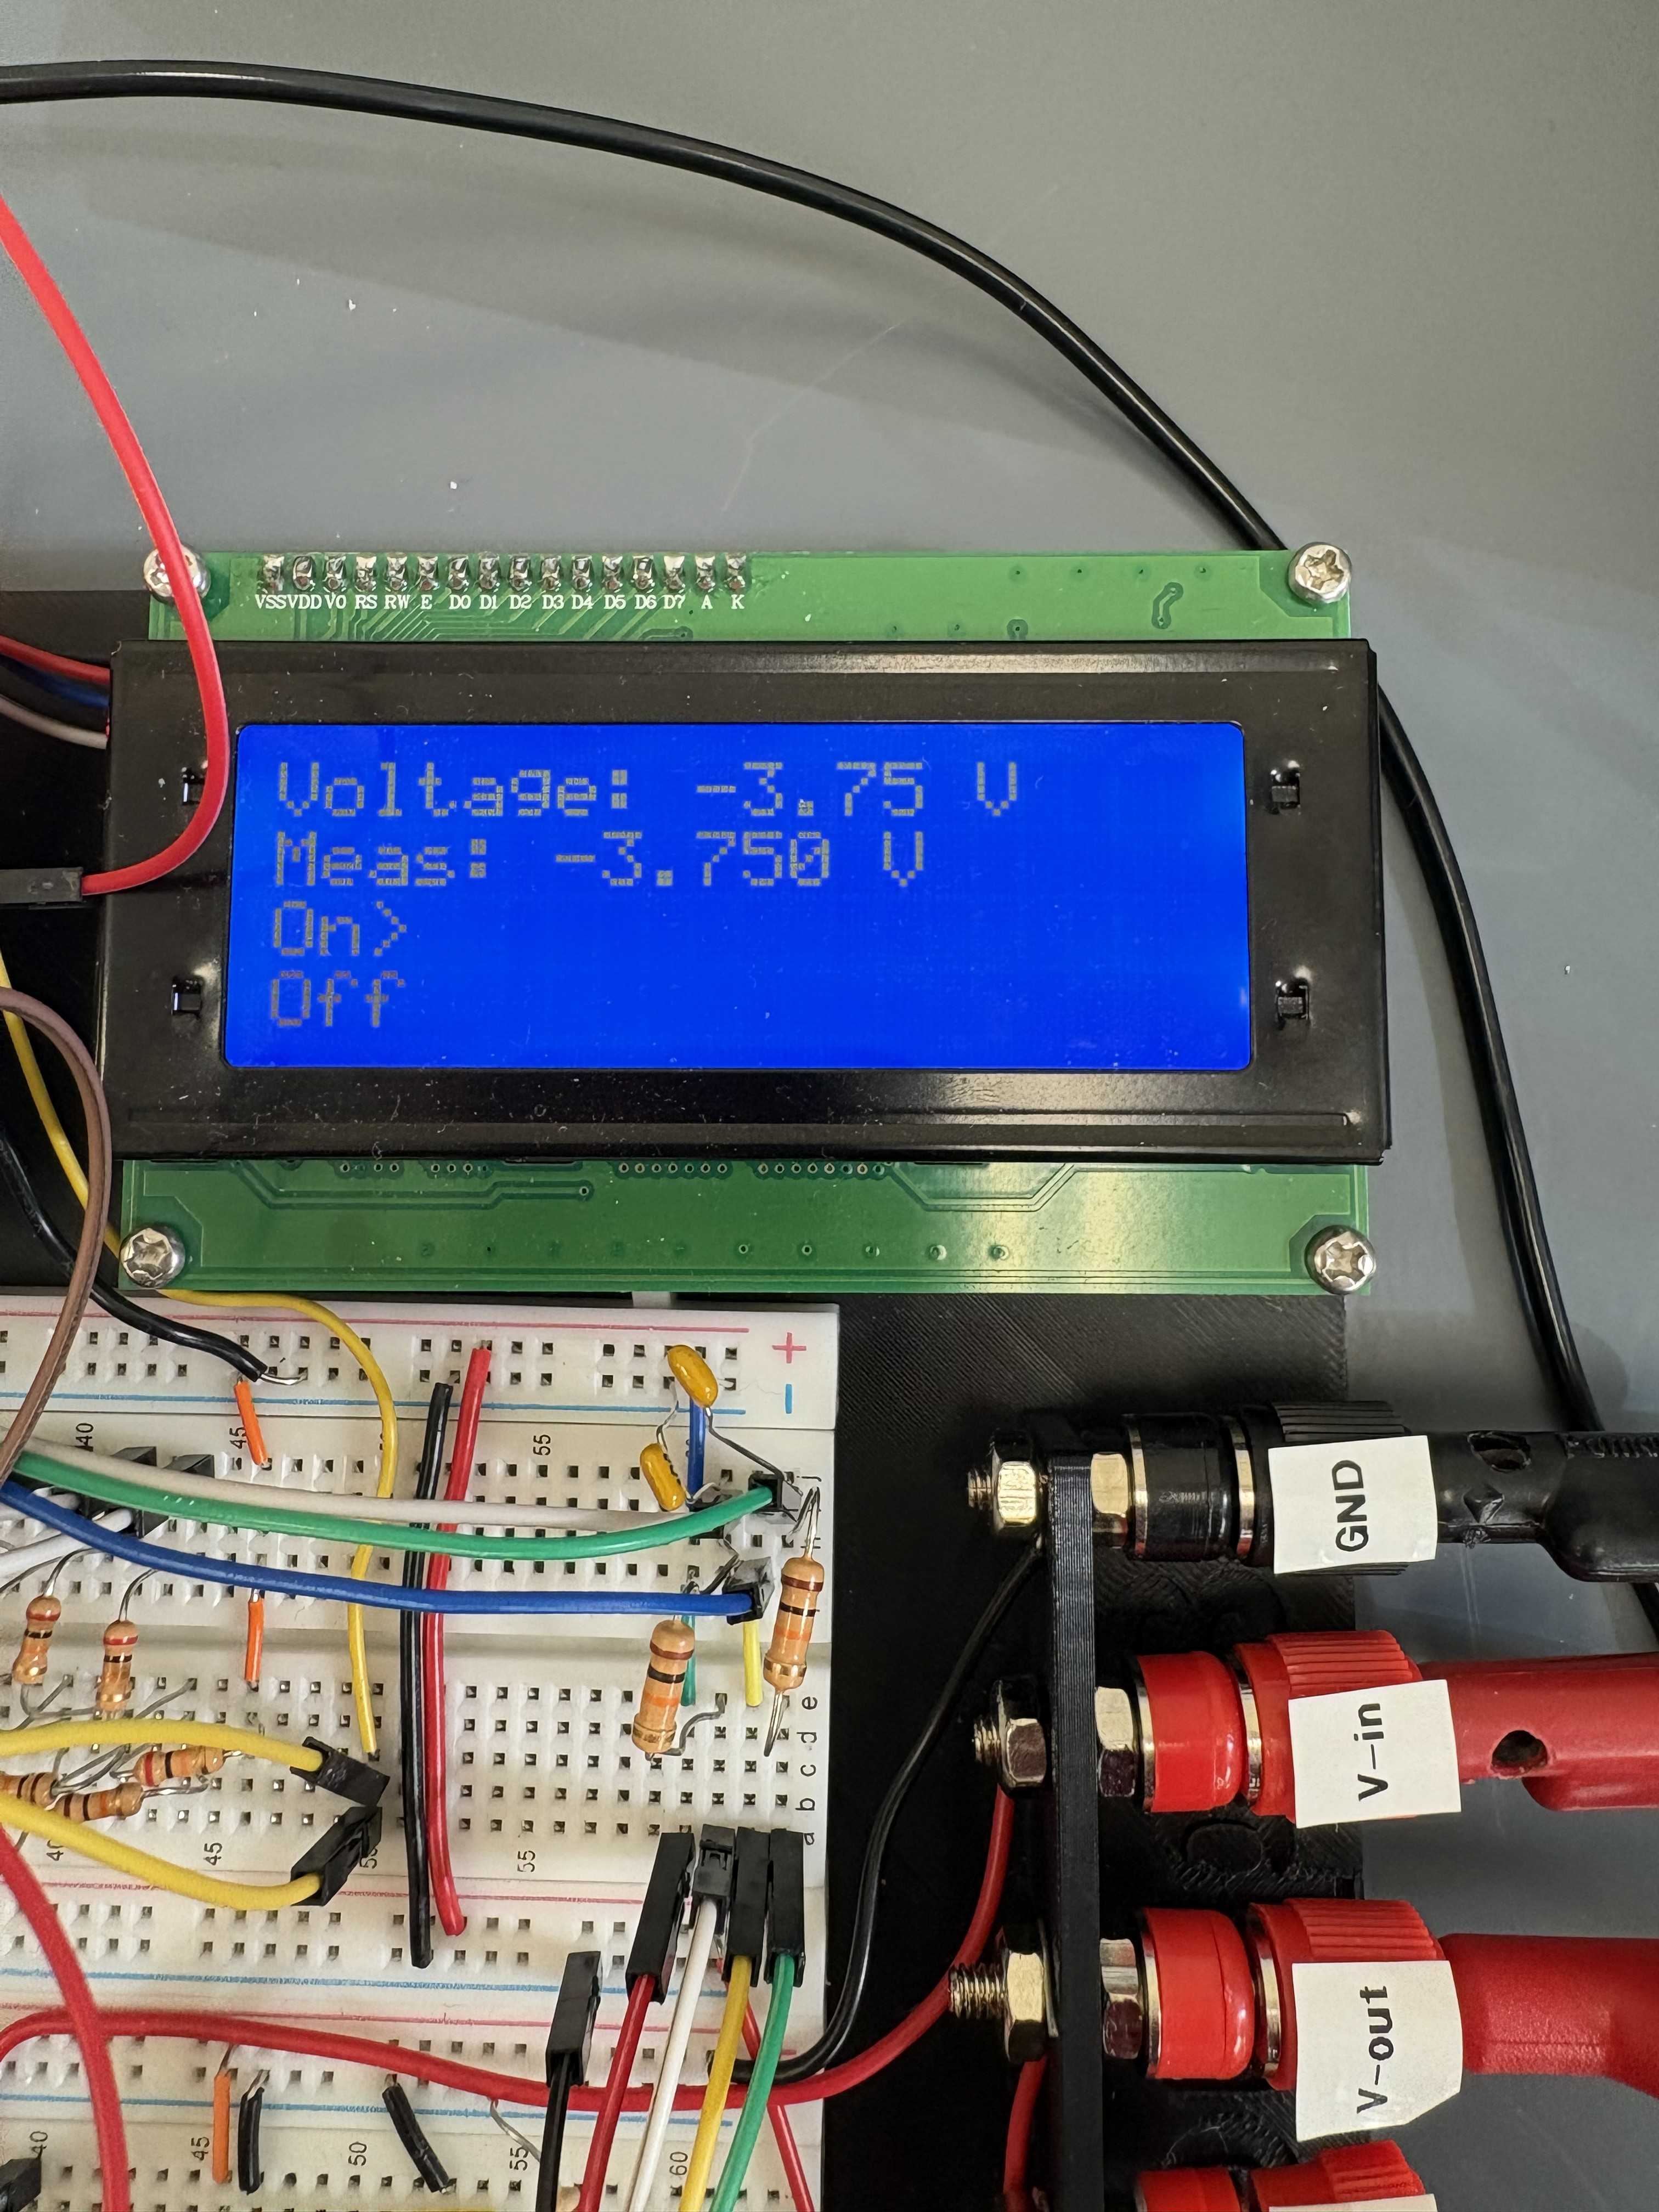
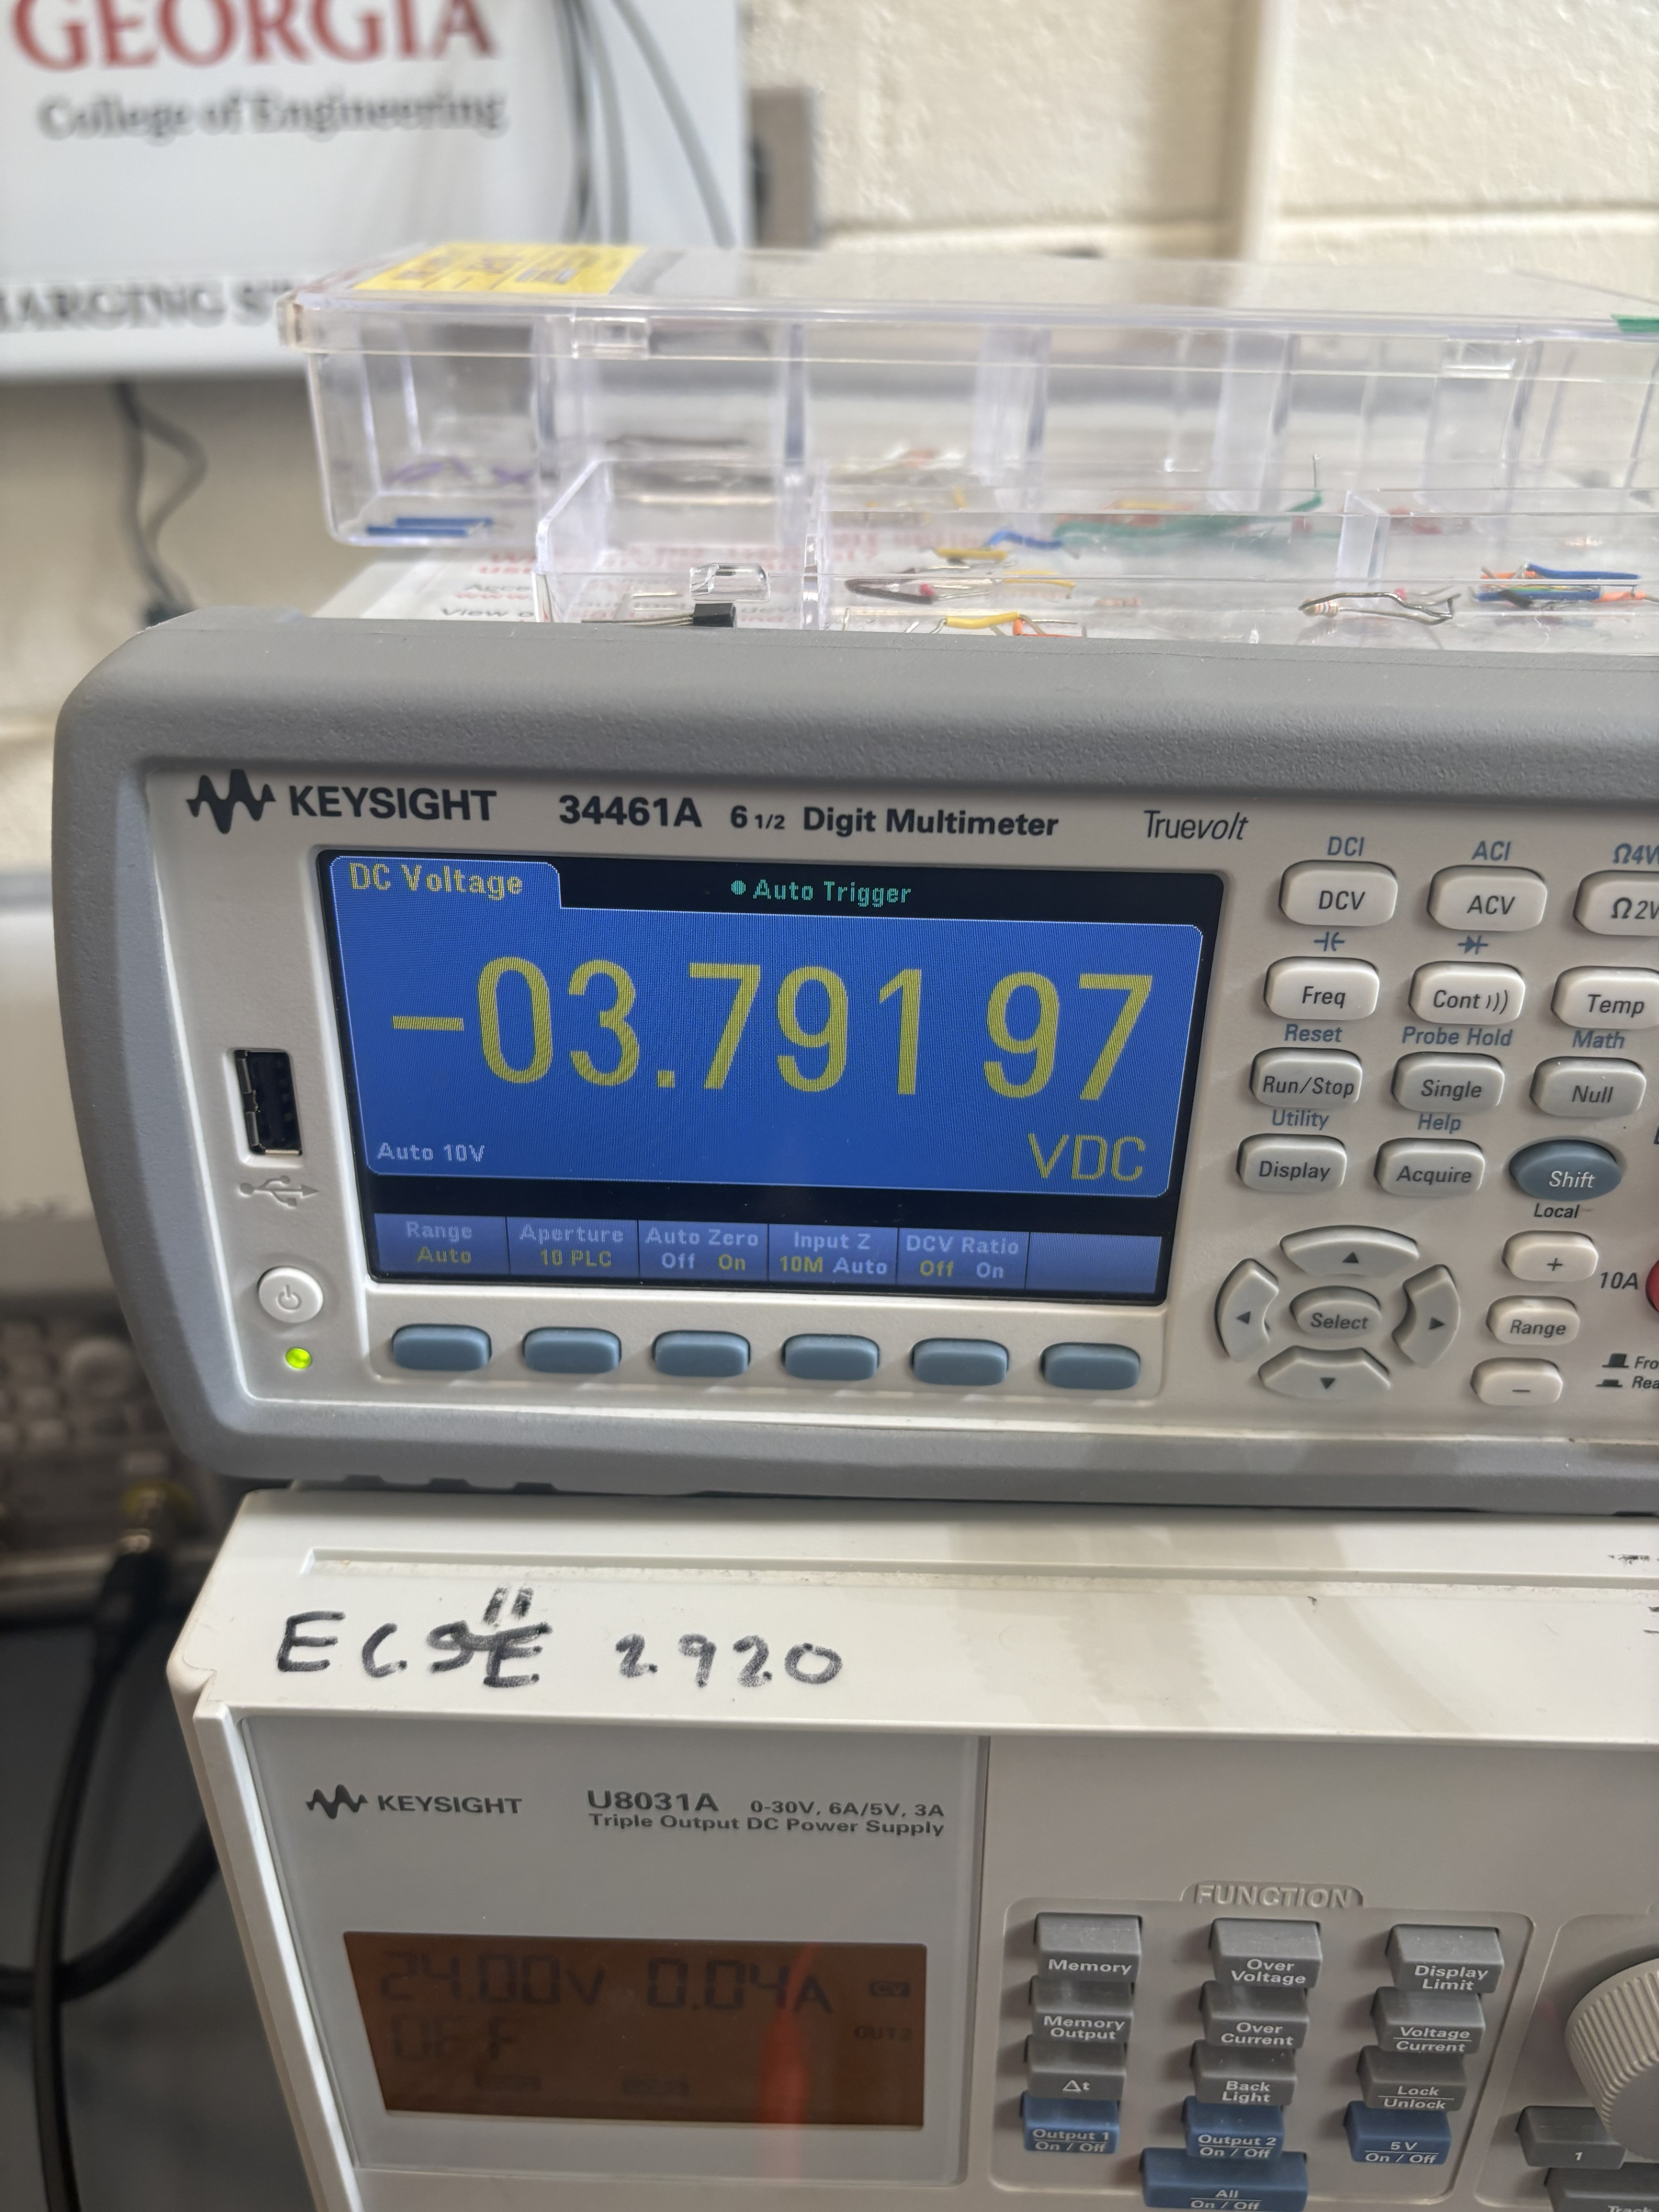
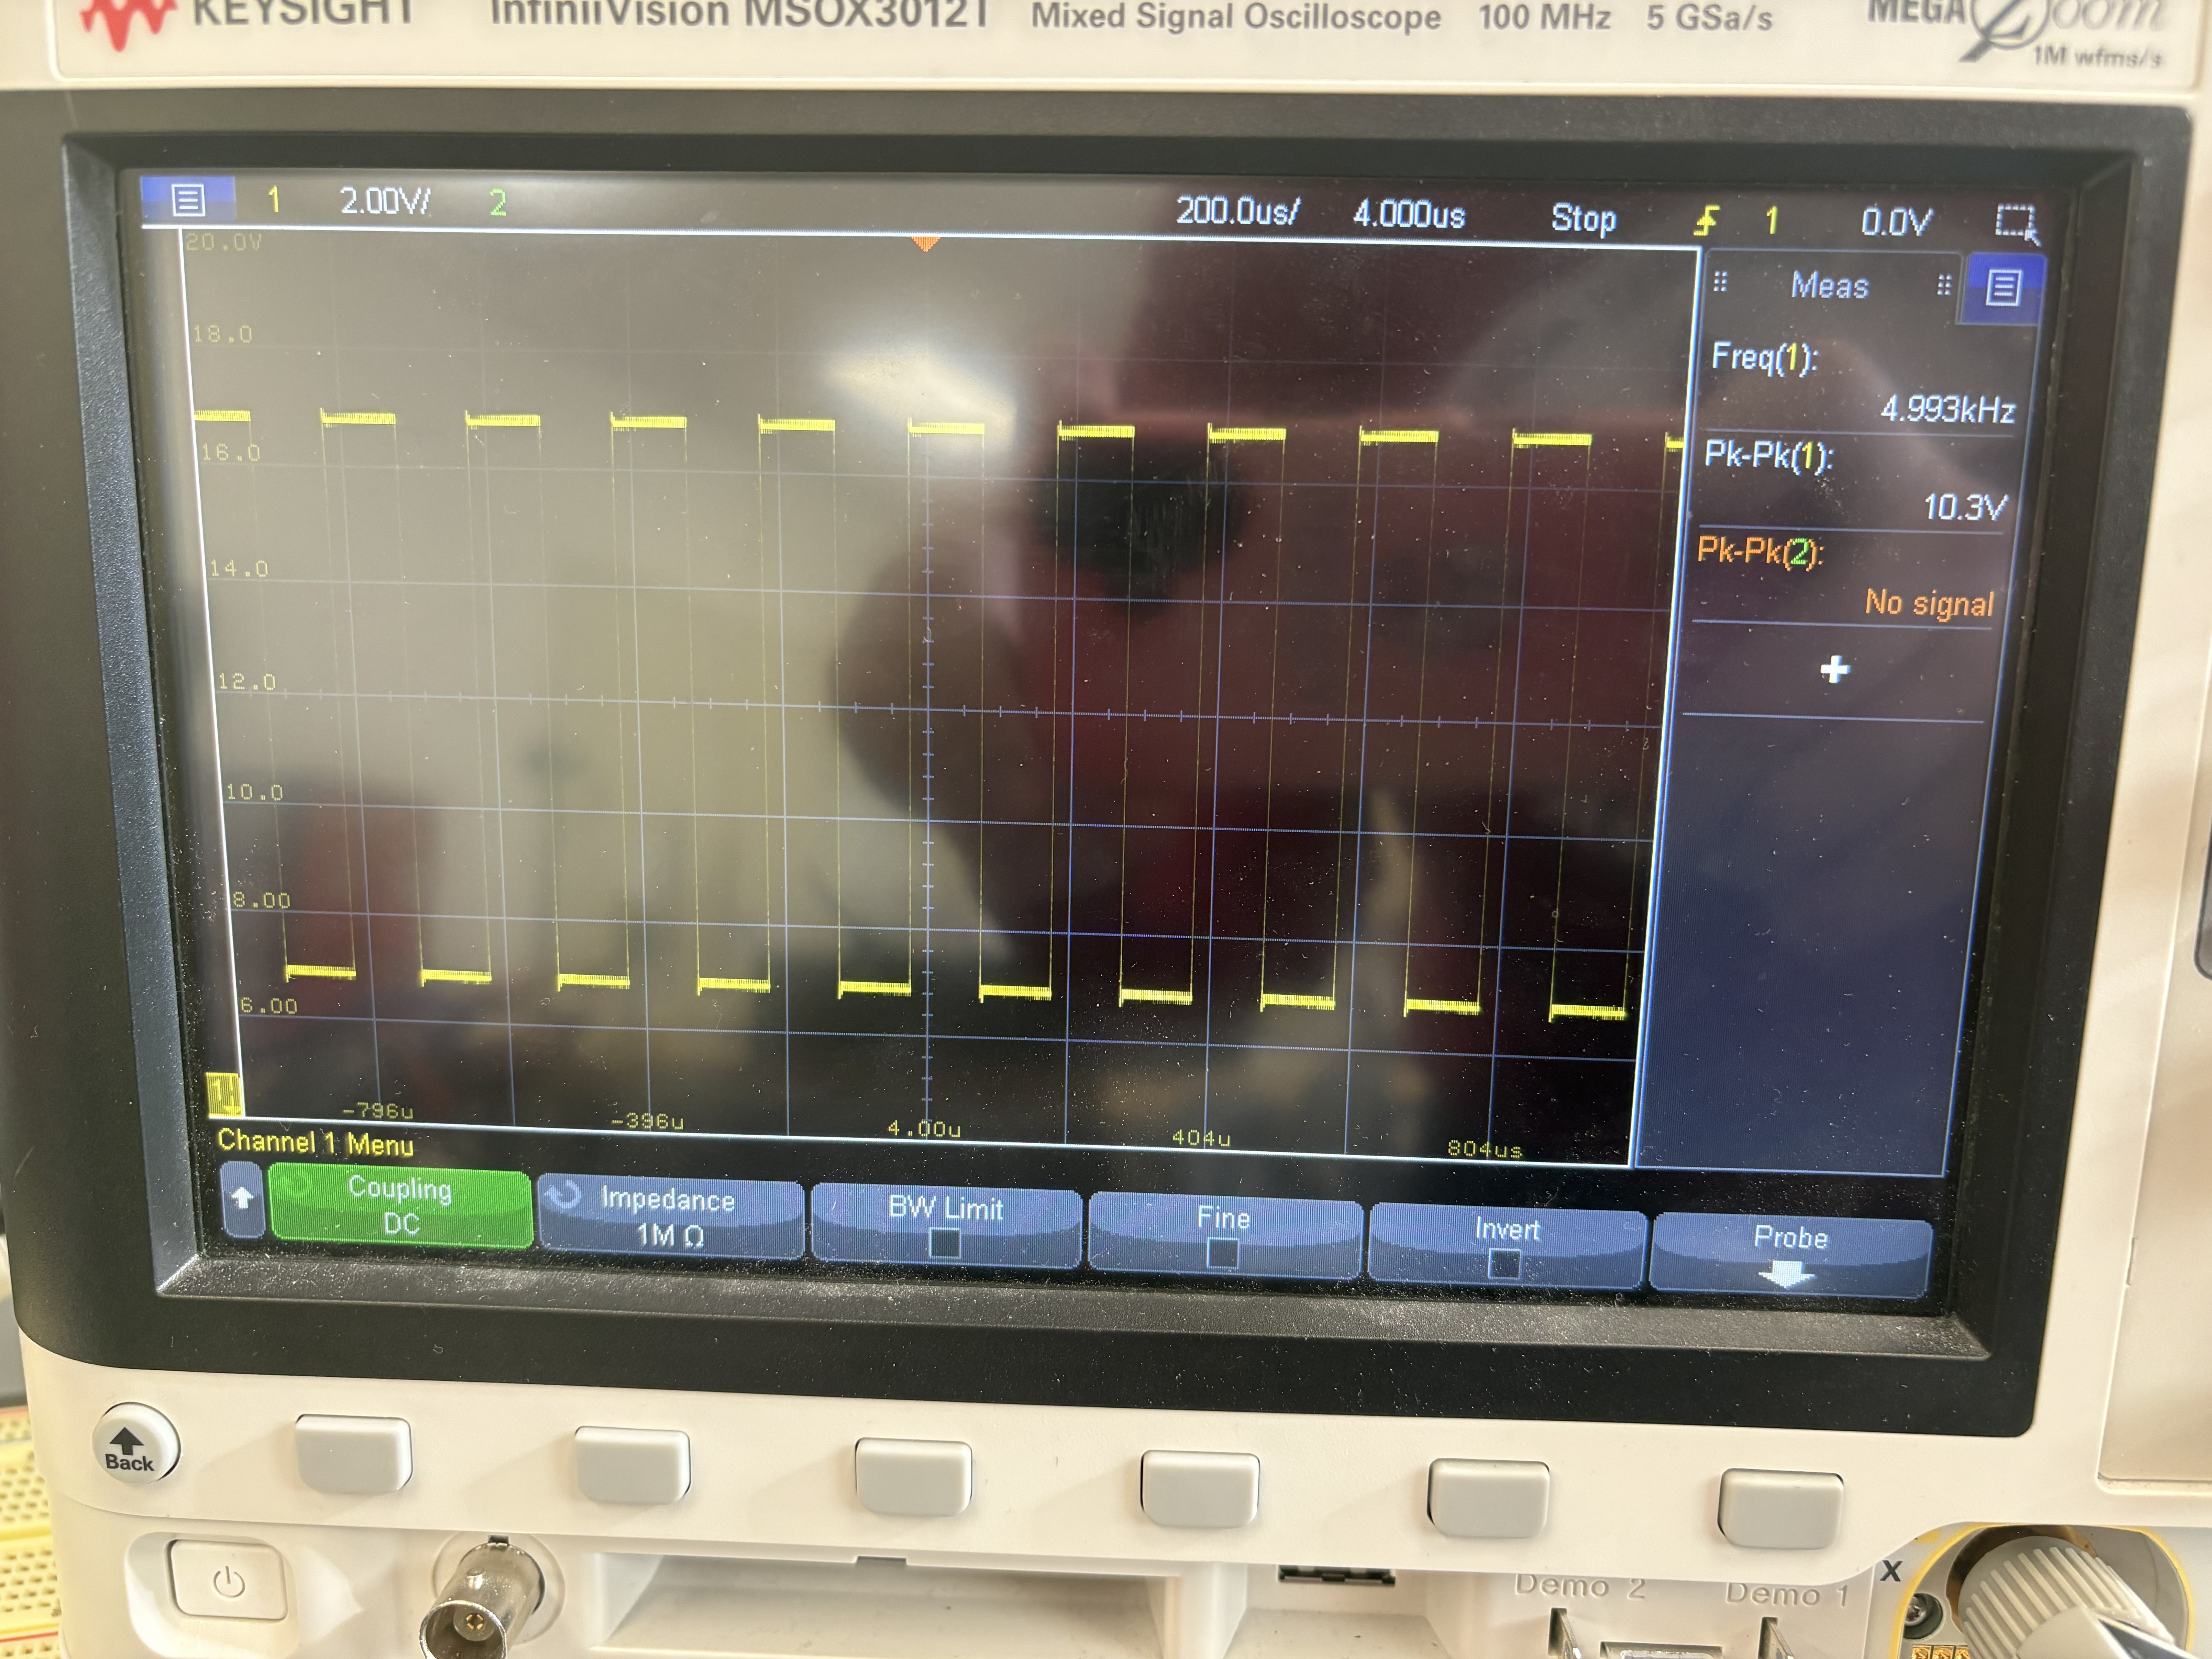
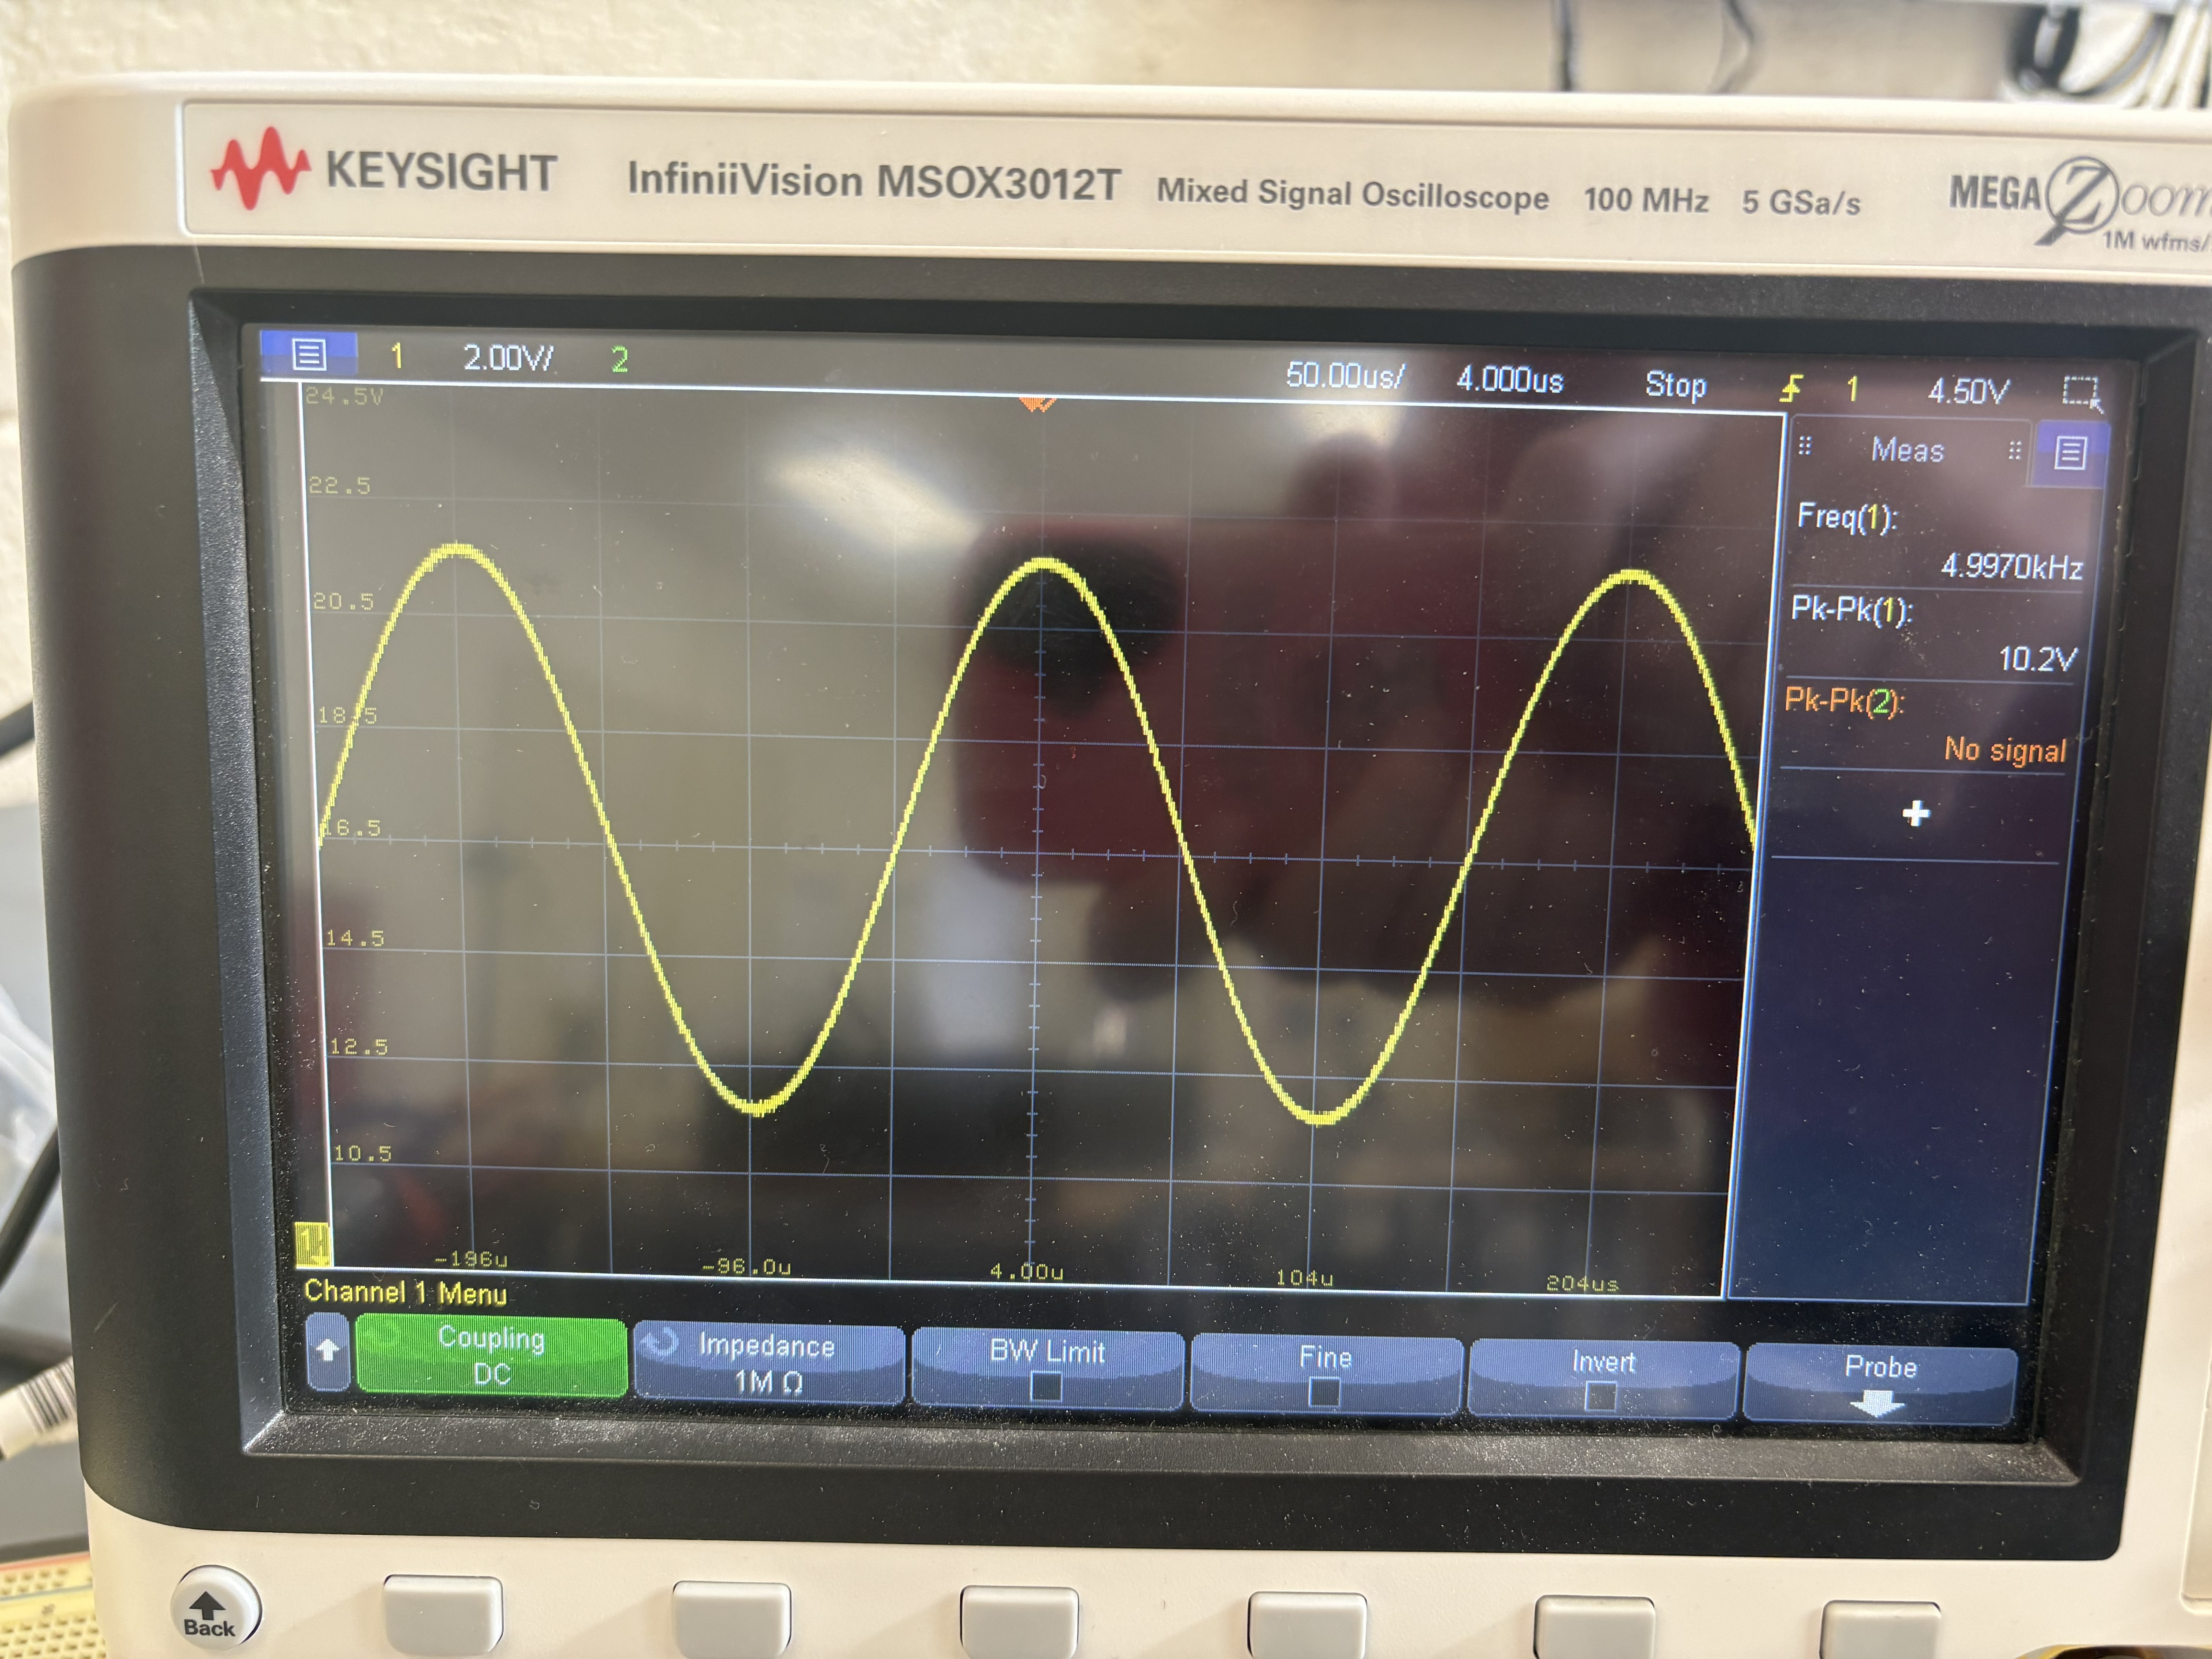
In my Design Methodology class, I was placed in a group of 5 students tasked with designing an electrical workbench controlled by a Raspberry Pi 4. The workbench was required to contain a voltmeter, ohmmeter, frequency measurement device, DC voltage output, and a function generator capable of creating both sine and square waves, along with an LCD display and rotary encoder for user control. Overall, while this was a difficult project, I am very happy with it and proud of the effort my group and I put in to make it happen.
In the spring semester of 2026, I took a class called Design Methodology. The class is centered around a semester long project that changes each time the class is offered. This semester, the project was an electrical workbench, with the goal being the creation of a device that included common tools used by electrical engineers or other electronics enthusiasts. These tools included an ohmmeter, voltmeter, frequency measurement, DC reference, and a generator of both square and sine waves. Further, to facilitate user interaction with the device, an LCD screen was to be used with a rotary encoder, and a intuitive GUI created for control of the device. The project began with group selection, which was done by the instructors based on a survey students filled out. I was assigned to group 3, which consisted of two electrical engineering majors: myself and Will, and three computer systems engineering majors: Joshua, Thejas, and William. With the team set, we got to know each other, then got straight to work.
The first order of business for this project was laying out team dynamics and expectations. This is an often-overlooked part of projects like these, but being sure that everyone on the team was on the same page with clear delegation of responsibilities helped the project stay on track and limited the possibility of portions of the project being overlooked due to miscommunication. As Will and I had more background in circuit design, we both took on the primary responsibility of hardware design and testing. Thejas had previous experience with creating PCBs so he took the lead on PCB design and manufacturing. Joshua and William’s primary strength was programming from their experience as with computer systems, so they took responsibility for the overall code structure and GUI. Of course, these roles were not strictly rigid, with each member having to wear many different hats throughout the project, but these gave us a good idea of individual responsibilities throughout the semester. With the roles set, there were further discussions about other team responsibilities/needs, like meeting times, work organization, etc. Once all of these had been taken care of, we started work on the project itself.
The first need of the electrical workbench was to set up some form of controller that could be used to handle all the inputs and outputs that would be used during the project. For the sake of uniformity in the class, the instructors provided each group with a Raspberry Pi 4 to use, along with a protection hat designed to prevent damage to the GPIO pins. Our group’s first task was to set up the Pi with the protection hat to make it both functional and easy to use. Will and I did a lot of leg work on this, as we knew that hardware testing and debugging would be vastly simplified if the Pi was set up to be worked with easily. Firstly, an operating system was flashed to Pi the common protocols the Pi supports (SPI, I2C, etc) were enabled for future use. After this, we set up a github repository on the Pi and enabled ssh. With ssh enabled, we used the ssh extension in VScode to allow us to connect to the Pi wirelessly, making programming and control of the Pi extremely easy. With this done, a thorough analysis was done of the protection hat provided that would be used on the Pi. Of particular note was the GPIO protection, with a small resistor in series (preventing overcurrent) and a 3.3V Zener diode connecting from the GPIO pin to ground (preventing overvoltage). While these served to protect the Pi, they would have the unintended consequence of changing GPIO input and output behavior, which would need to be considered in all of our designs.
With the Pi ready to go, we could move onto designing the first stage of the project. Here, the group split into two tasks: GUI beginnings and digital potentiometer control. Thejas, Will, and William primarily worked on the GUI beginnings, while I worked on the digital potentiometer control. The start of the GUI control consisted of getting the LCD screen and rotary encoder working with the Pi, then getting the two working together. It was at this point where the group had to make a major decision about code structure. During a meeting, we discussed the matter and decided it would be best to make a main code file that handled the GUI, then each component we created would have its own library with functions that could be called in this main file. We felt this was best as it both kept the code well organized and allowed for easier testing and troubleshooting. With this decision, the LCD and rotary encoder were connected to the Pi according to their datasheets, then libraries created to control them. While that was happening, I was working on the digital potentiometers. For this project, we were given two single and one dual MCP4x31-103 digital potentiometers. I researched these thoroughly, diving through the datasheet and SPI protocol used to control their resistance. Once I had done this, I created a digital potentiometer library and connected them to the Pi. With the LCD, rotary encoder, and digital potentiometers working, we now had a good foundation to build on.
Moving forward, the next thing to tackle was creating a rail splitting power supply to power OPAMPs used in future designs. One of the unique constraints in this class was the only hardware that could be used was items supplied in the kit we received at the beginning of the semester. Thus, in order to use the TL08x OPAMPs supplied to use, we needed to take a 24 V source supplied to us and split it into +/- 12 V. Will and I tackled this head on, with a lot of time spent on iterating the design. We understood that without a stable supply, our future designs would likely be doomed from the start, so we wanted to get it right the first time. The design we ultimately came up with was a modified push/pull amplifier using MOSFETs whose gates were controlled by an OPAMP which received feedback from the 12 V virtual ground node. This configuration gave a stable 12 V node that was tested up to 72mA but could theoretically supply much more current. Further, a 3.3 V supply was created to power other parts of the project with 3.3V instead of using the Pi’s supply (as this was a constraint of the project). This design was very similar to the rail splitter, with a BJT controlled by an OPAMP to output 3.3 V. This design was tested up to 50 mA and remained stable. With this, we were satisfied with the design and added it to the project. An important thing to note here is we tied the Pi’s ground to the 12 V virtual ground node. This is talked about more in the final report (more on this later)[RB1.1], but basically, doing this allowed our signal processing to be vastly simplified.
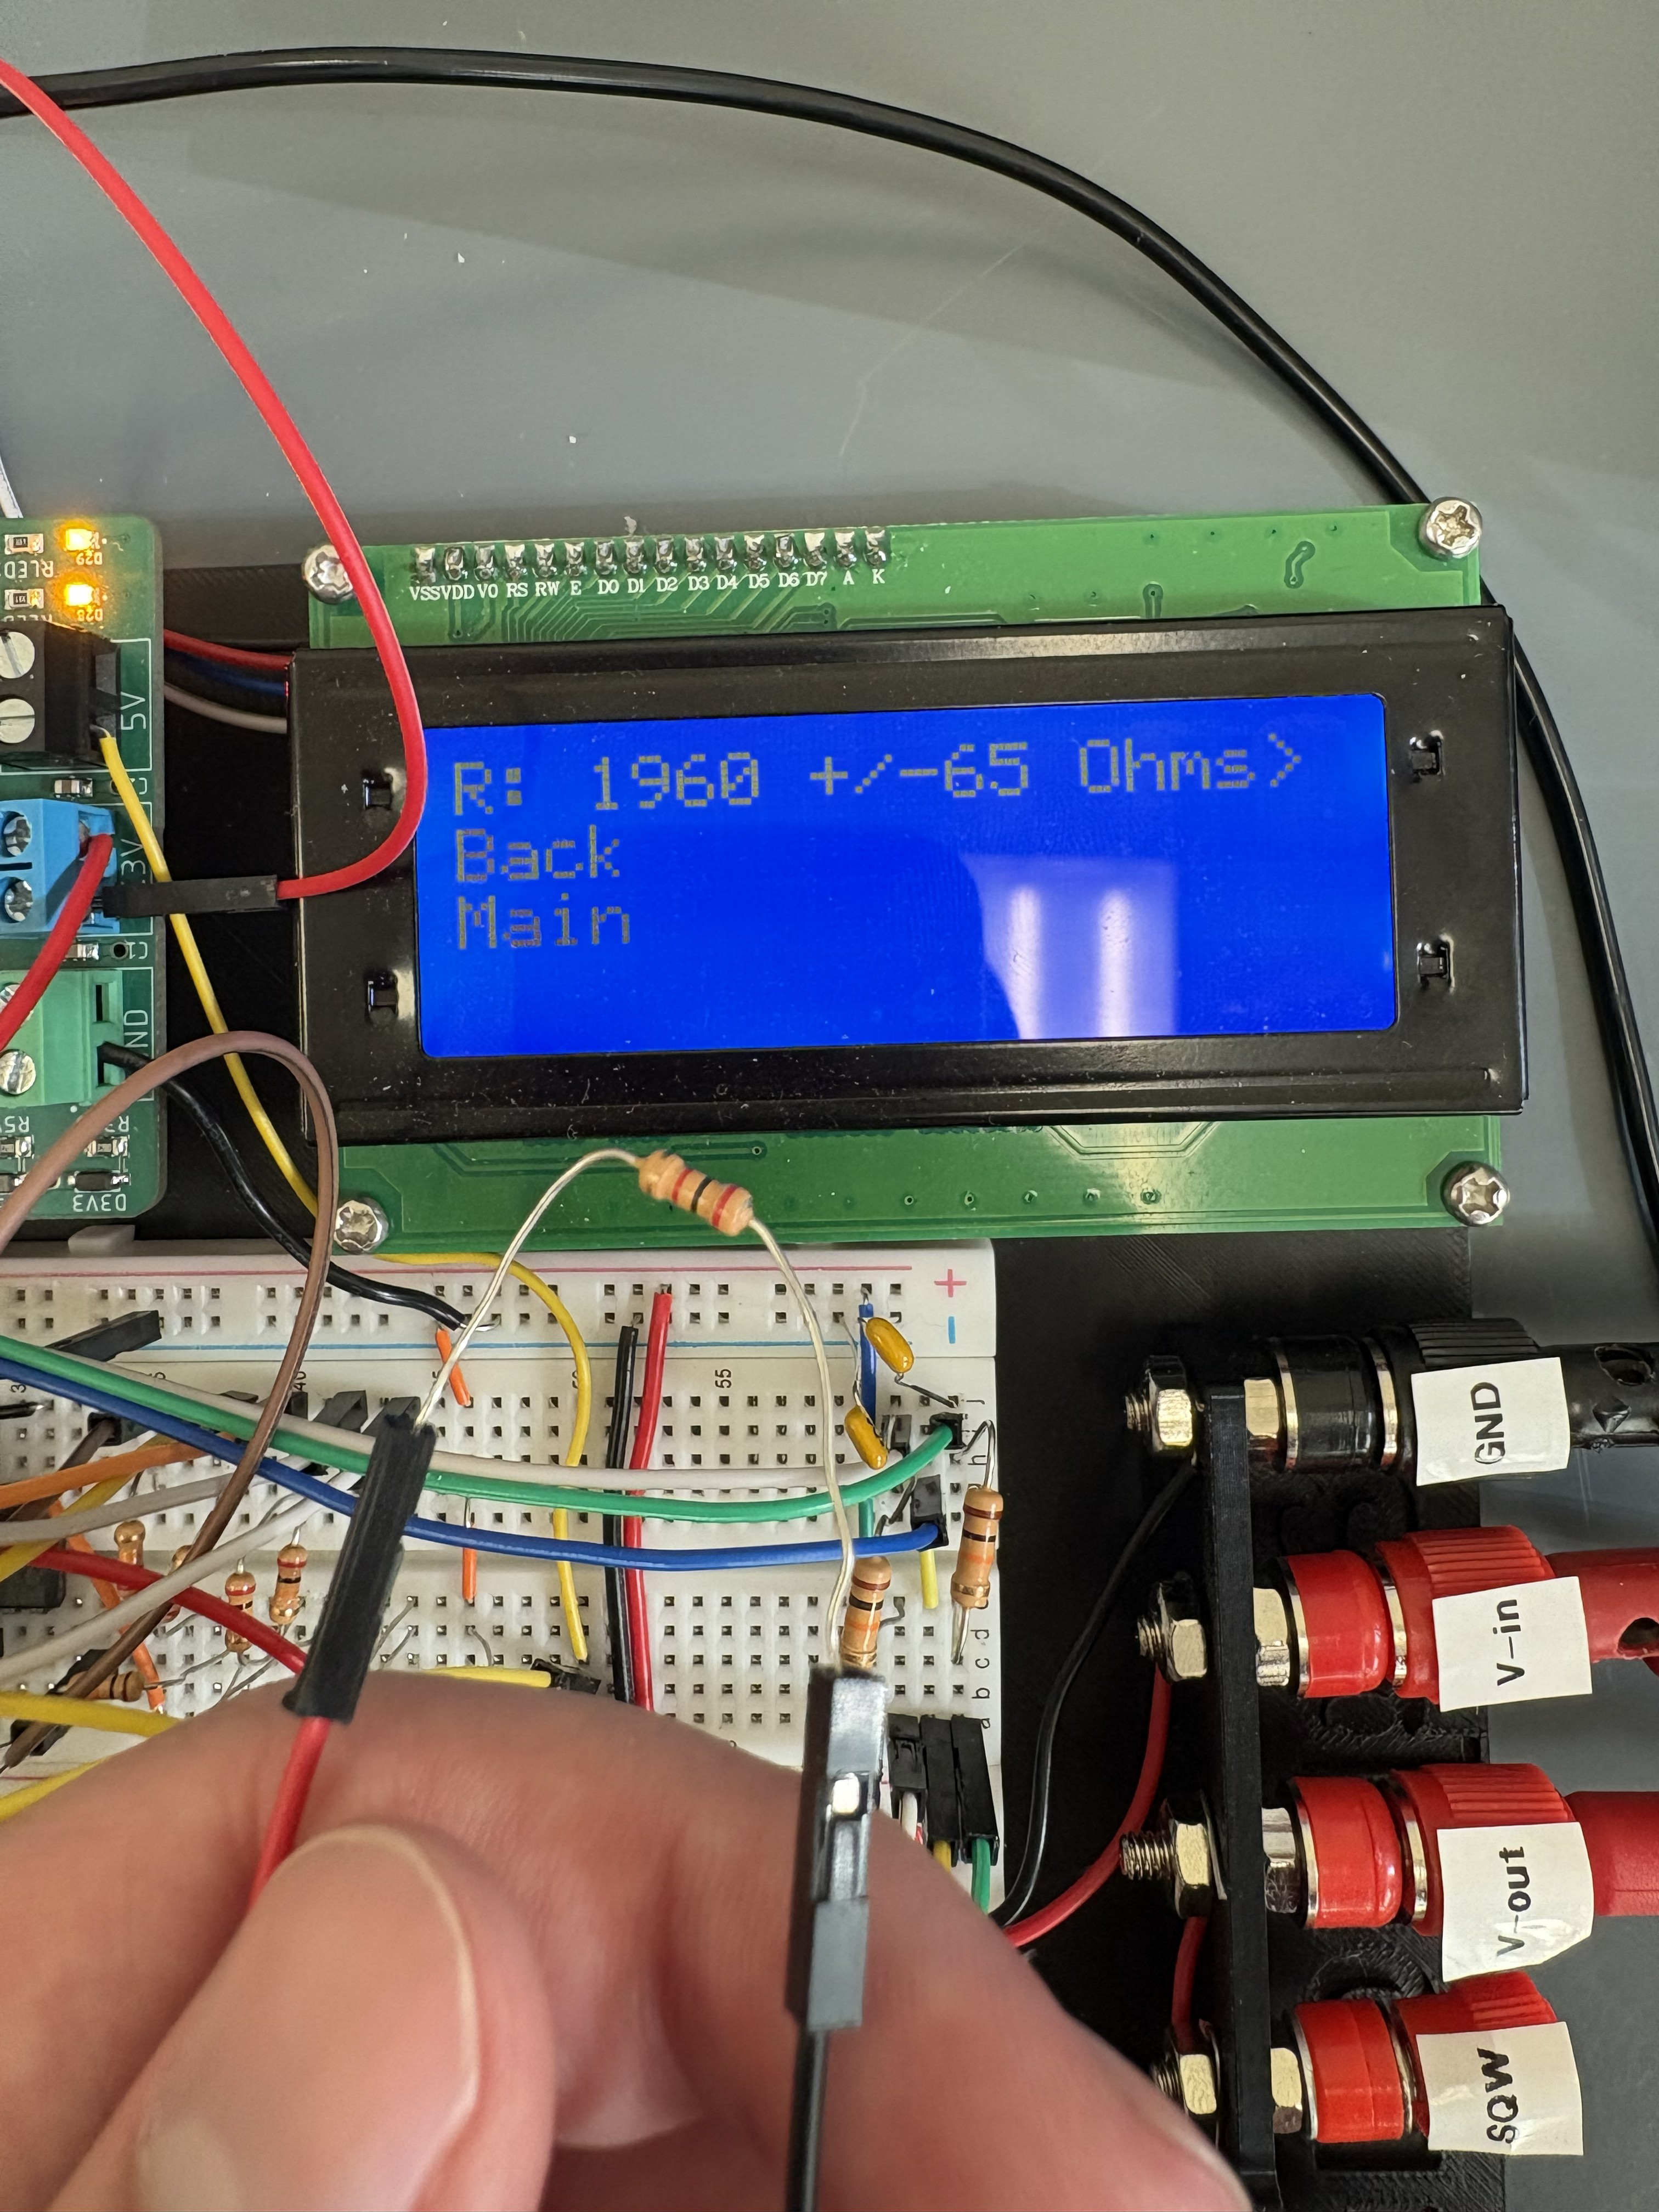
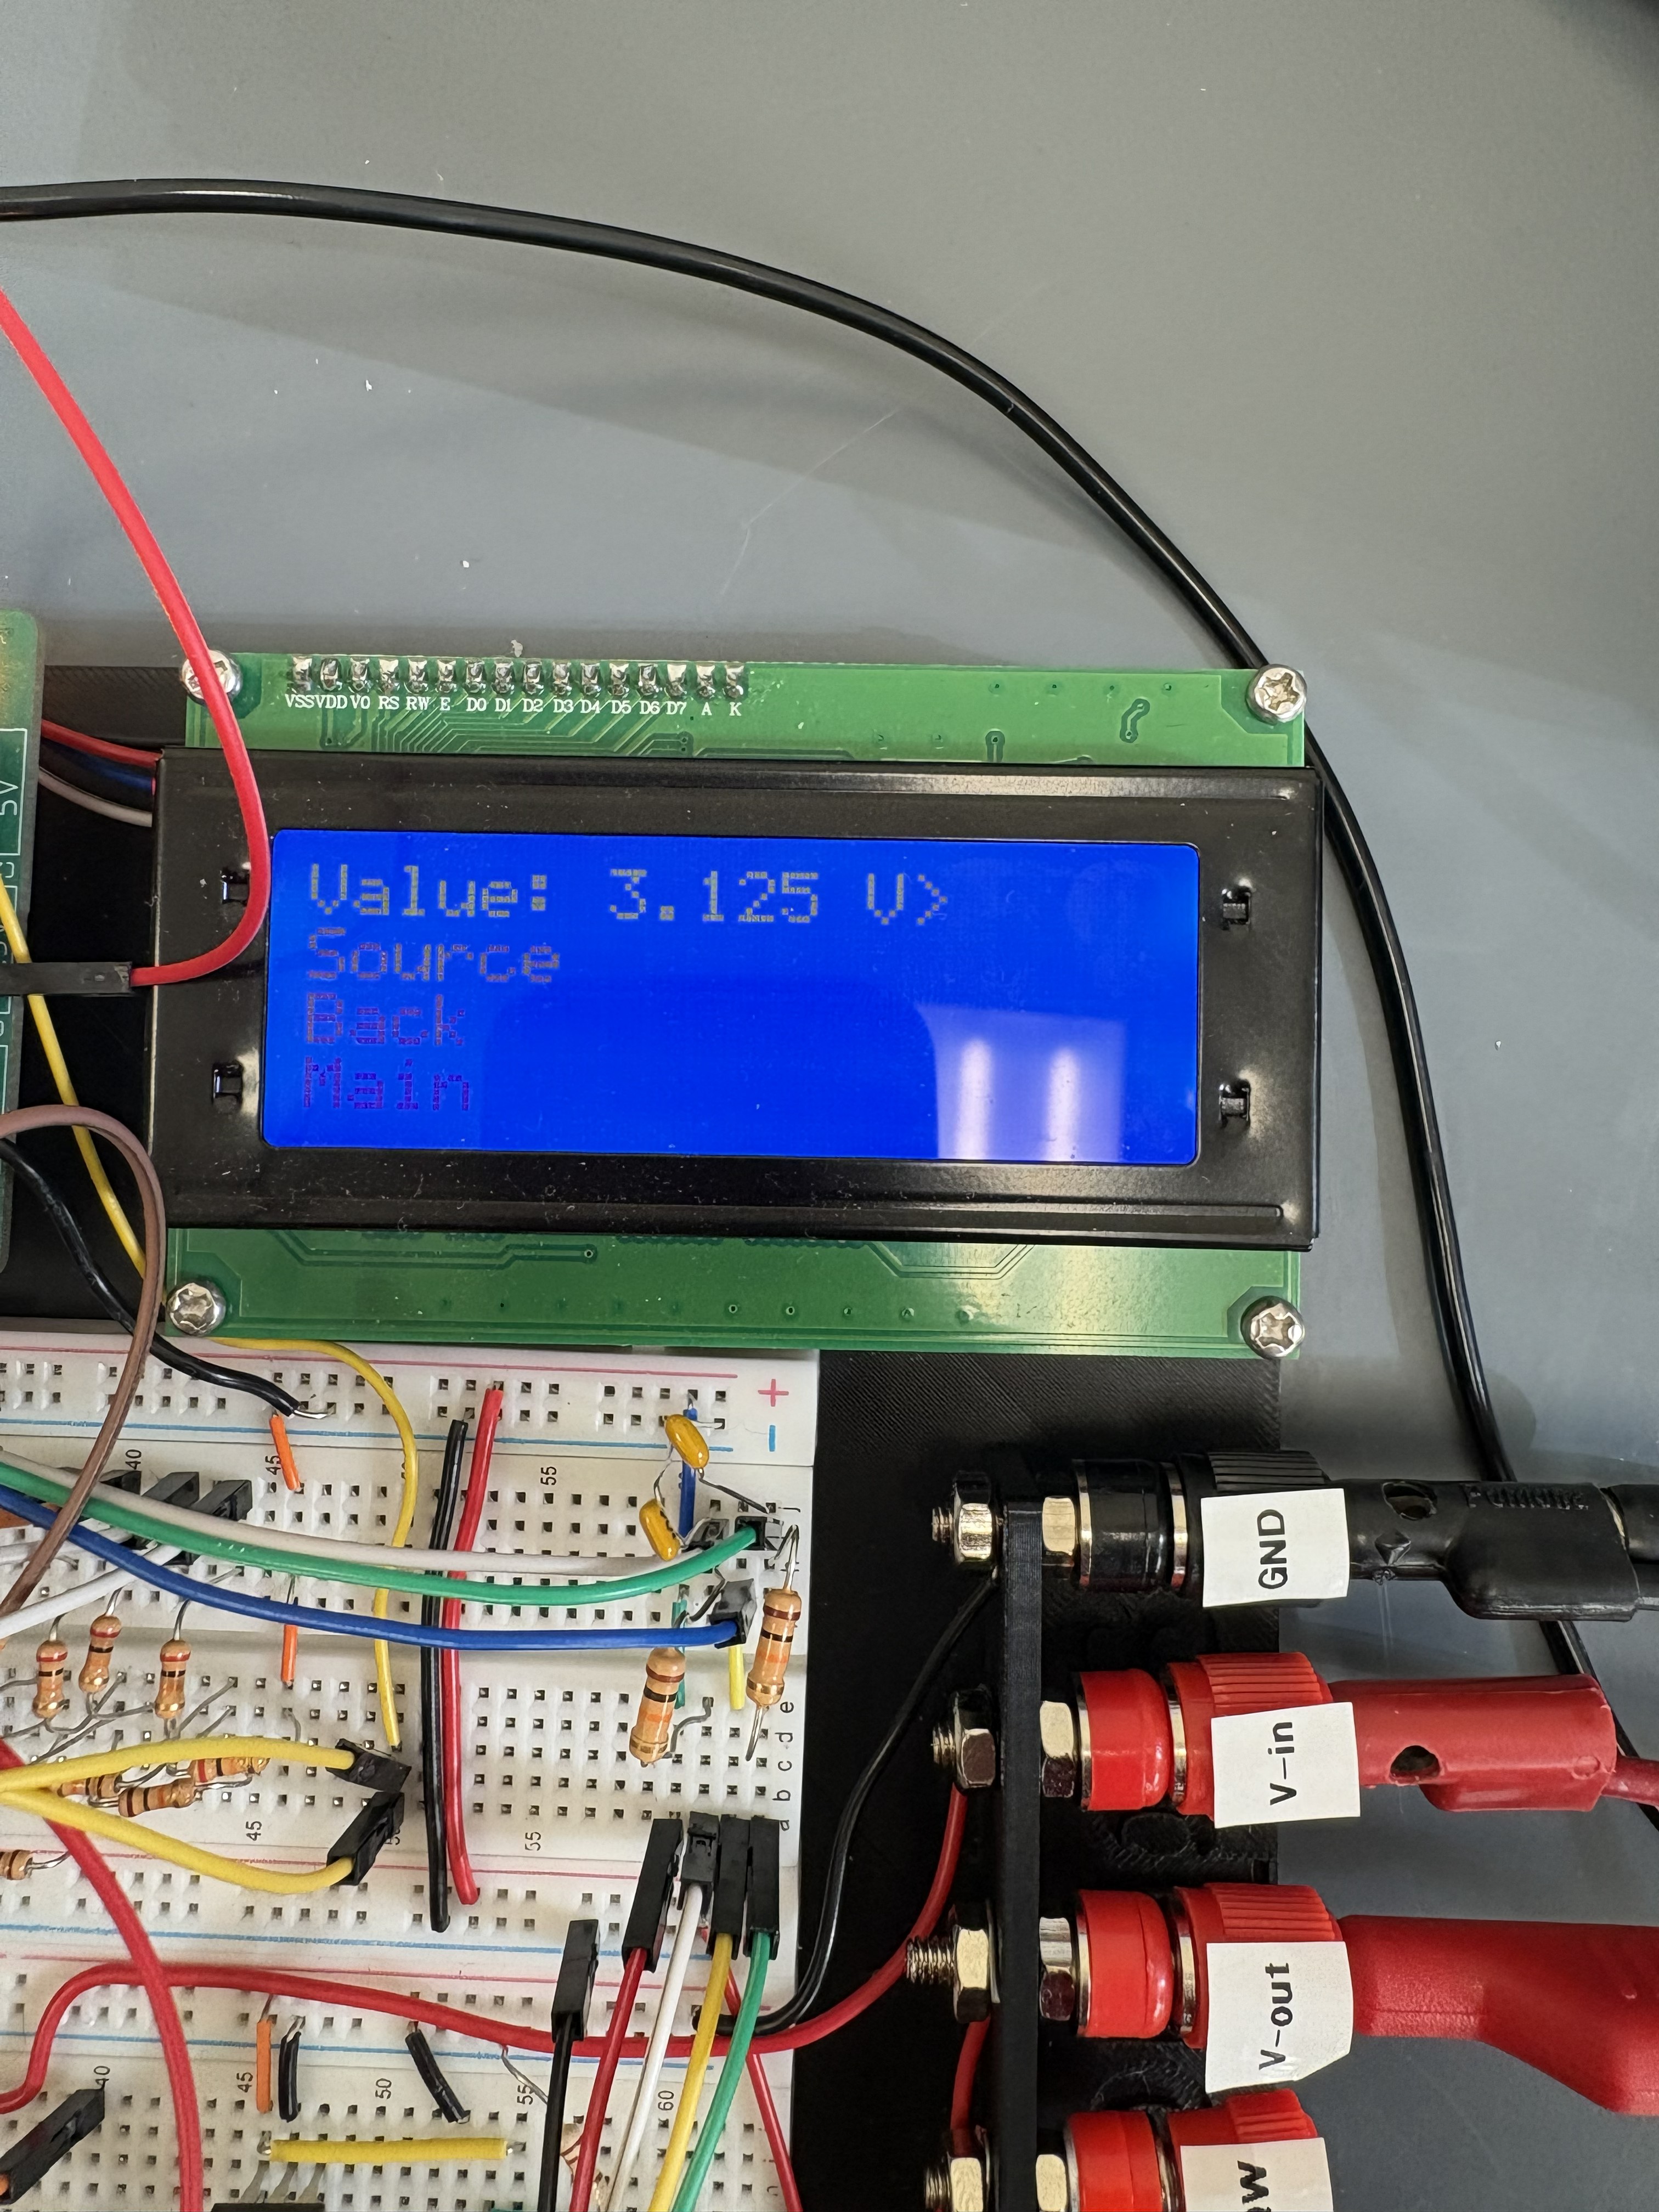
With the power supply complete, work moved onto two of the major measurement components of the workbench: the ohmmeter and voltmeter. Will and Joshua primarily worked on the design of the voltmeter, while William and I worked on the ohmmeter design. The voltmeter was required to measure a voltage between -5 and 5 V, with a measurement tolerance of +/- 0.3125 V. To do this, we first needed an ADC to convert our analog input into a form usable by the Pi. To do this, a 5-bit SAR ADC was created using an R2R ladder controlled by GPIO pins as the DAC, and an LM339 comparator used to compare its output to the input analog signal. However, this configuration only measured a signal between 0 and 3.3 V, so a difference amplifier was used to scale and shift a -5 V to 5 V signal to 0 to 3.3 V. With this hardware designed, a library was created to control the voltmeter and get a reading from the SAR, completing the design of the voltmeter and meeting the constraints set forth. While work was done on the voltmeter, William and I worked on the ohmmeter. The ohmmeter was required to read a resistance between 500 Ohms and 10 kOhms, with no particular accuracy required. While there was no minimum accuracy, our group still strived to make our design as accurate as possible. To do this, we came up with a Whetstone bridge based design, with one side of the bridge being an even voltage division of 3.3 V to 1.65 V, and the other being a known resistance in series with both the unknown resistor and one of the digital potentiometers. The voltages of the bridge would go into another one of the LM339’s comparators, which would output to a GPIO pin. In this configuration, by changing the digital potentiometers position, the digital potentiometer resistance that results in the change of the comparator output from low to high can be used to calculate the unknown resistance. With this hardware design, a library was created to control the ohmmeter, and testing was done on it. After applying a calibration constant to our readings and doing some calculations, it was determined that the ohmmeter had an error of +/- 65 Ohms. We would have liked to have cut this down even further, but the constraints of the project limited us in this regard, so we were happy with the design and moved on.
With these measurement items complete, we moved onto the DC reference and square wave generator. The DC reference was required to output a voltage of +/- 5 V with a resolution of 0.625 V, along with being able to be measured by our voltmeter internally. For the square wave, we needed to create an x-axis centered, 50% duty cycle wave with a variable amplitude in steps of 0.3125 V and frequency range between 100 Hz and 10 kHz. Will and I were primarily responsible for designing the circuitry for these systems. I mention both systems at the same time because our though process was that if we could get a square wave generator working, the DC reference could be made to just be the square wave toggled high or low. Thus, we began working on the square wave generator, with plans on adding the DC reference after getting the final design. For the square wave, we decided to use the Pi to generate a PWM signal, then condition this signal using OPAMPs and two of our digital potentiometers to control the amplitude. We chose this design compared to an oscillator because we felt the most difficult part of the design was frequency control, which the Pi takes care of for us. After the creation of a square wave control python library and testing the design, we got it working well. With this, we moved onto the DC reference design. By modifying the square wave library, we could get the PWM output to be constantly held high or low. After this, the DC reference hardware was designed, with an OPAMP used to scale the output to +/- 5 V, then another OPAMP and comparator used to get the internal voltage reading from our voltmeter. After extensive testing, we found the output for the square wave, DC reference, and DC reference voltmeter reading to be working as expected and within tolerance, so we were happy with the design.
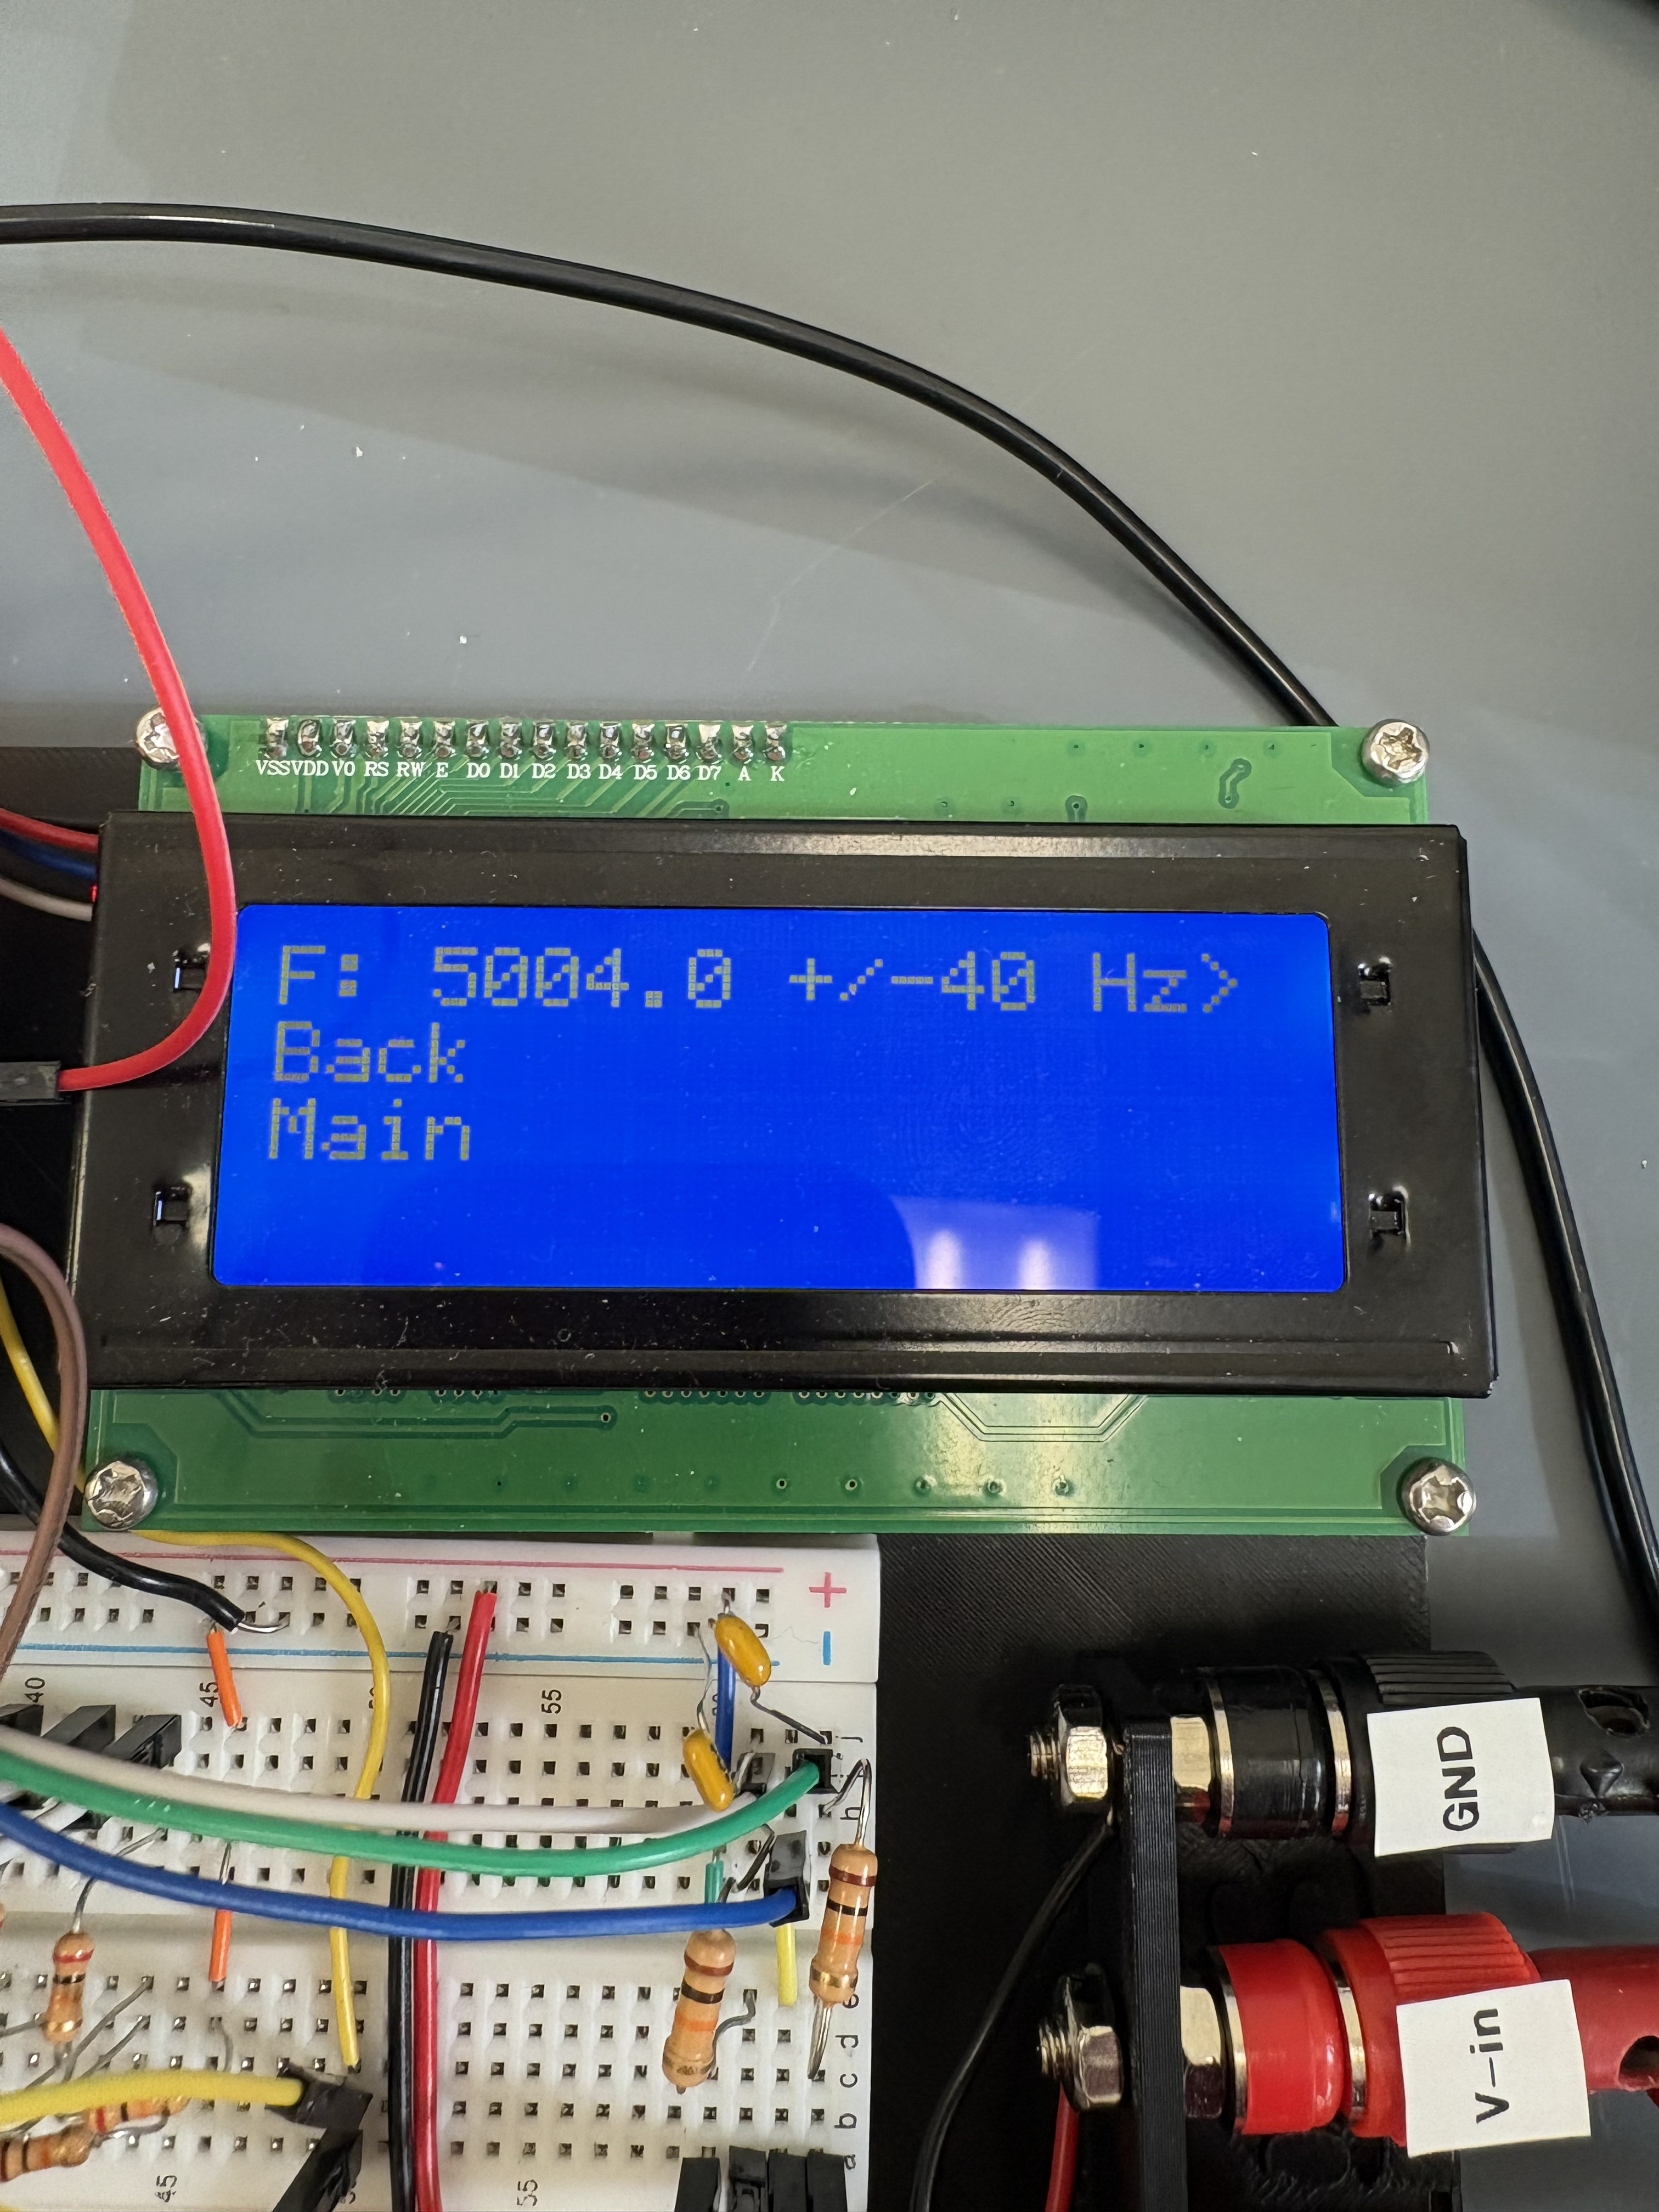
With that, we moved onto the final design portion of the project, with two major components to be added: the sine wave generator and the frequency measurement. For this, Will and Joshua worked on the frequency measurement, while William and I worked on the sine wave generator. The frequency measurement was required to measure the frequency of a positive voltage sine wave between 1 kHz and 10 kHz. The hardware design consisted of a decoupling capacitor that centered the input sine wave on virtual ground, then an OPAMP compared the sine wave to virtual ground and output a roughly 12 V to 0V square wave of the input frequency, which was then input to a comparator which output the same frequency square wave, just scaled to 3.3 V. This was then input into the Pi, and a library created to calculate the frequency of the square wave input to the GPIO pin. With this, the measurement was tested and found to be remarkably accurate, with a final uncertainty of the measurement determined to be +/- 40 Hz. For the sine wave generator, this turned out to be my favorite part of the project. This is because we came up with a unique design that innovated on the constraints of the project. The sine wave generator needed to output a positive voltage sine wave between 0 and 10 V (with resolution of 0.625 V) and have a variable frequency between 1 kHz and 10 kHz (with resolution of 500 Hz). At first, this seemed to be a daunting task, as there really isn’t an easy way to generate a sine wave with purely analog components, and it is even more difficult to make one with variable frequency and amplitude. However, in research, I had an epiphany. The Raspberry Pi has an audio jack, and with software control, I can make it output a set frequency, which is a sine wave. With this, we would only need to worry about conditioning the sine wave instead of creating it. Thus, our design consisted of output from the audio jack shifted by an OPAMP to be positive voltage only, then scaled using a digital potentiometer and OPAMPs to control the amplitude of the sine wave. I was really happy with this design and through testing, it showed a very clean output sine wave (you can see it in a few of the images above). With this, we made another library to control the sine wave, and our hardware design was done.
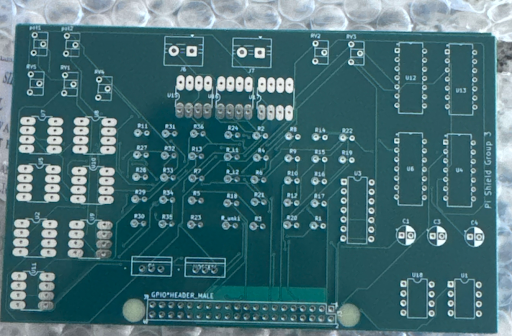
With this, we moved on finalizing the project. Throughout the project. Thejas was diligent with designing the PCB of the project. He used Kicad as he had previous experience with it, and he did a great job with it. Our original goal was to have the project working on the PCB for the final showcase, but time constraints prevented us from doing this, which was unfortunate. We still ordered the PCB though and got to have them as keepsakes of the project (pictured above)[RB2.1]. Our final order of business was to create the final report of the project, documenting everything relevant to its functionality. We had been keeping up with it throughout the semester pretty well, so we just needed to add some final sections and touch it up. I would love to show this report and other documentation like the github repository on this page, but as this project is repeated in this class, I don’t want to share the fine details of the project. Because of this, if you want some more information about the project, or to see some of the documentation I don’t provide here, please contact me and I will be happy to provide you with these materials. Overall, I really enjoyed this project and felt it did a good job of advancing my skills as an engineer.